When will mortgage rates go back down?
Mortgage rates blasted from 3% to 6% in a short period of time. Here is when I think they will go back down.
As of Friday, mortgage rates appear to be hovering just under 6%. One week ago they were hovering just over 5.5%, at 5.58%. Mortgage rates have jumped in response to the Federal Open Market Committee’s (FOMC) decision to raise the Federal Funds Rate (FFR) by 75 bps. This pushed the effective FFR to 1.58%. And they aren’t done yet. The FOMC is signaling that during July’s meeting they anticipate having to raise the FFR another 50-75 bps in order to further control inflation.
In my household, we have been casually talking about moving, locally, for the past 3+ years. We even offered a new home a few years ago, before home prices had soared. Are we still talking about a move? Ah, no. Between ridiculously high real estate prices and the recent jump in mortgage rates, plus adding in all the other economic uncertainty such as regular layoffs, we are staying put for a while.
The question is how long are we planning to stay put? Our daughter starts high school this fall. Being the planning type, my wife and I are already discussing where we will live when she starts college. Because, all parents know that if you aren’t within a reasonable driving distance, say 10-15 minutes, the kids aren’t coming home to visit with you regularly. So, we anticipate moving closer to campus in the next 1-4 hours.
As part of that planning process, my wife asked when I thought mortgage rates would go back down. I didn’t have an answer. So, I started doing some research.
Here is what I found.
Do mortgage rates follow Fed funds rates?
A 75 bps rate increase is one thing for consumers to have to swallow. Another 50-75 bps in July will no doubt hurt even more. That, however, is just an increase in the FFR. First, we need to look at how closely mortgage rates follow the FFR. It turns out that they are pretty well aligned.
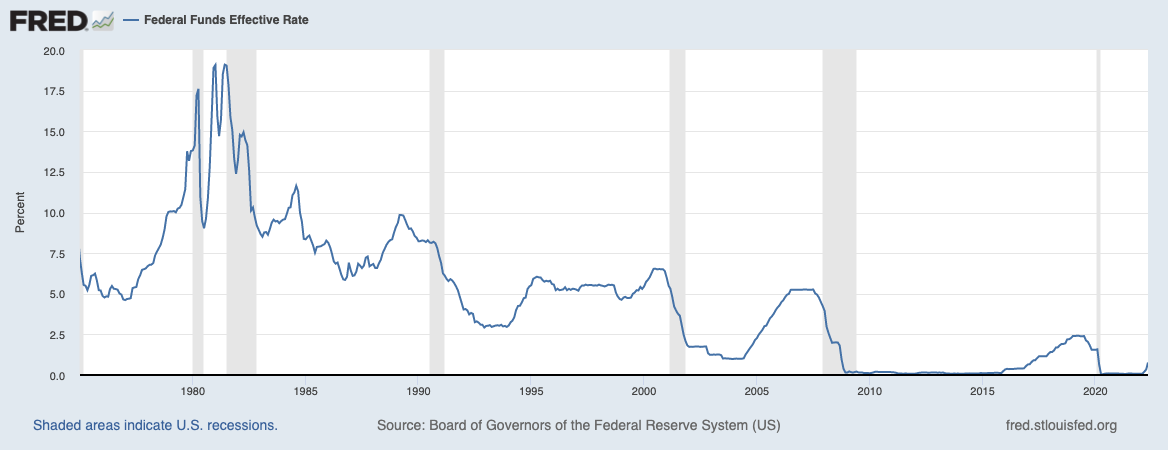
Here is the graph of the FFR from 1/1/75 to 5/1/22.
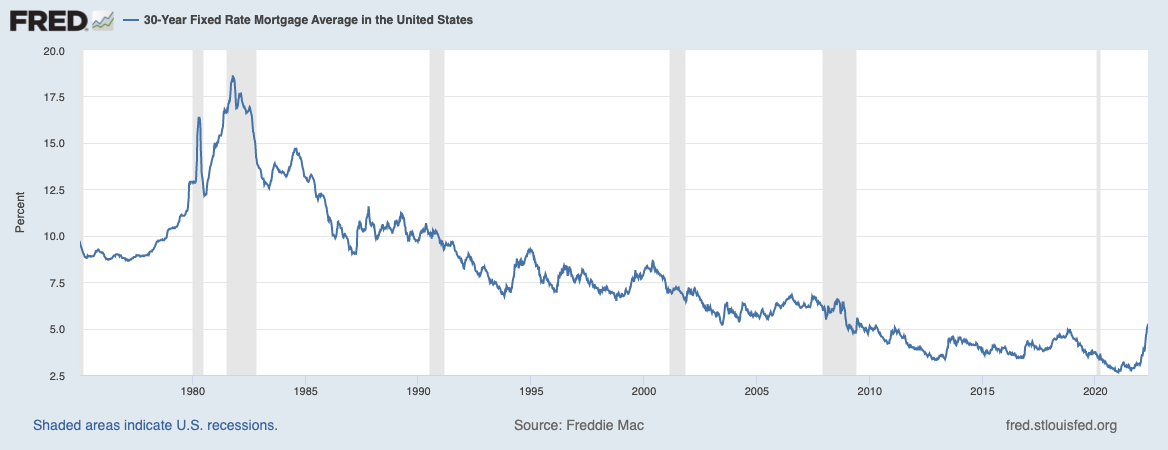
Here is the graph of mortgage rates for the same time period.
If you want the raw data you can head to the links above yourself and download it, or I request access to the spreadsheet that I aggregated it all into.
The first thing you might notice is that the FFR graph has more ups and downs, while the mortgage rate graph descends a bit more smoothly. That is more a function of the frequency of reporting. The FFR is tracked monthly, because it can only change monthly based on FOMC meetings and decisions, whereas, mortgage rates are tracked weekly.
Knowing this, if you look at the two graphs and understand the frequency differences it becomes pretty obvious that mortgage rates do follow FFR increases and decreases. Perhaps not perfectly, but very, very closely.
One more note - the average FFR and mortgage rates during this period were 4.7% and 7.76% respectively.
The cost of higher mortgage rates
Ok, so we know that mortgage rates tend to follow the FFR. With the recent 75 bps increase, mortgage rates spiked to roughly 6%. So, let’s take that as our baseline. If in July the FOMC raises the FFR another 75 bps, which is my prediction (hey, back off, I got the June increase right here), then mortgage rates should push up to around 6.5%-6.75%. By, the way, the last time we saw mortgage rates that high was in June of 2007.
Let’s compare that, 6.75%, to 2.75%, which is close to what mortgage rates were in January of 2021.
But, before we do that, the highest mortgage rate during the period I used was 18.63% in October of 1981 and the FFR was just over 15%.
Alright, here we go. I’m going to use the average home price in the U.S. I know it might sound high to some. It is around $405,000.
Interest over the life of a 30-year loan (this is just interest!)
At 2.75% - $190,290
At 6.75% -$541,315
Payment on a 30-year loan (just principal and interest; not including taxes, PMI, etc.)
At 2.75% - $1,653
At 6.75% - $2,627
Um, ouch. That extra 4% is going to cost you, yes, you, $350,000 over the life of the loan. Let’s be smart folks. How bad do you really “need” that new home?
Mortgage rate predictions
Predictions from this article just two days ago say that rates will stay at 5% through 2022 and remain as high as 4.4% until 2024.
Two years with very little movement might feel off. Especially since the increases in the FFR are meant to control inflation and, hopefully, even bring prices back down a little bit. But, is does that work? Let’s revisit the correlation between the FFR and mortgage rates.
In May of 2004, the FFR was at 1%. That is the lowest the FFR has been from 1975 to now, excluding the time since the Great Recession. Mortgage rates at the time were 6.32%. That is pretty close to the relationship right now.
From May 2004 until July of 2006, the FFR rose to 5.24%. What happened to mortgage rates? In July 2006 they hit 6.74%. It wasn’t until the Great Recession that mortgage rates bothered to come back down below 5%. Which happened in March of 2009. They didn’t go below 4% until November of 2011 and it took the pandemic to hold them below 3.5% for three years.
Reading the Tea Leaves
Predicting things is always a dangerous business. But there are a lot of analysts out there that write articles and never tell you what they truly believe will happen. I don’t want to be that guy, even at the risk of being wrong.
So, here goes.
We are going to stay at 5.5% or higher through 2022 and not drop below 5% for the next three years.
As long as conditions remain relatively the same. Things such as another large recession, the war in Ukraine expanding outside its borders, China’s economy collapsing, the resurgence of a pandemic (notice I didn’t just say COVID related), etc. can easily change that trajectory.
But, I don’t think we are going to see mortgage rates below 4% until something like the above occurs.